The Alley Mat profiDRAIN slatted floor covering tested here, a resilient floor covering in the lying and walking area for dairy cattle, beef cattle and fattening bulls, fulfilled the requirements of DIN 3763.
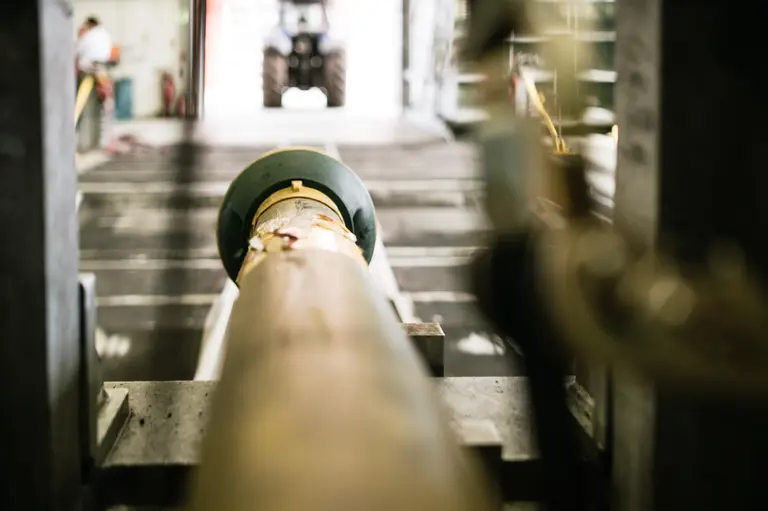
As part of the Agritechnica 2025 technical program, experts from practice, testing, research, and industry discussed alternative drive concepts on November 9 at the DLG Expert Stage ‘Smart Efficiency.’
This episode features: Kim Schoukens, founder of Women in Ag Magazine and, together with DLG, the German Agricultural Society, presenter of the Women in Ag Award.