

Download print version
Test report 7575
The approval
The DLG QUALITY SEAL for operating equipment and consumables encompasses products, which are subjected to extensive testing of their value-determining and advertised characteristics.
The tested criteria and the requirements to be fulfilled are specified by independent commissions and are designed – over and above legal requirements – to prove the product’s fitness for purpose, its advertised characteristics and practical requirements.
Testing contents and requirements are developed further by the responsible specialist departments of the DLG e.V. in line with the applicable legislation, as well as with technical and scientific progress.
Successful testing is concluded with the assignment of the DLG QUALITY SEAL. The approved products are then published.

Assessment in brief
Modern diesel engines are equipped with highly precise fuel injection systems featuring extremely fine nozzle holes, which are particularly sensitive to contamination and deposit formation. These deposits, originating from incomplete combustion processes, from fuel impurities such as oxidation products, dissolved metals (e.g. zinc from galvanized tanks), and biodiesel residues, can impair the spray pattern and combustion process even after short operating periods. This may result in reduced engine performance, increased emissions, and in severe cases, engine damage.
The additive Keropur® DP5212 was evaluated using the procedure similar to the CEC F-098-08 injector coking test. The product demonstrated a significant ability to remove existing deposits from injector nozzles and to prevent the formation of new ones. Application of the additive led to measurable improvements in combustion quality and a restoration of engine performance.
The product
Description and technical data
Keropur® DP 5212 high performance diesel additive is developed for performance in industry tests CEC F-023-01 (Peugeot XUD9 engine), CEC F-098-08 (Peugeot DW10B engine), CEC F-110 (Peugeot DW10C engine) and for real-world vehicle fuel economy and performance, ensuring injectors are kept clean and free from deposits.
Keropur® DP 5212 was dosed into the diesel fuel at a concentration of 132 ppm v/v (142.5 ppm w/w).
The base fuel was a diesel supplied by Haltermann Carless GmbH. The used diesel fuel contained 5 % biodiesel (FAME) and was blended specifically so the test diesel was able to meet the following market diesel specifications:
- EN590
- ASTM D975
- CEC RF-06-08
The method
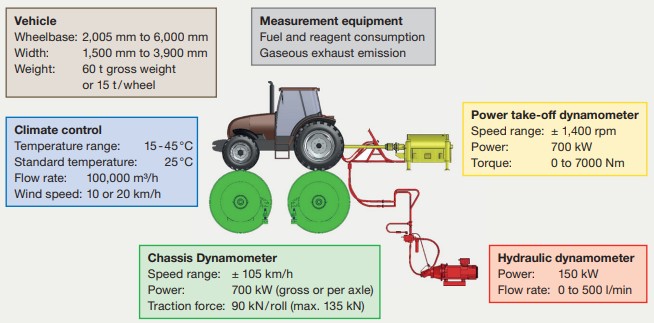
All the measurements were carried out at DLG’s dedicated off-road / agricultural chassis dyno (Figures 2 and 3). Our chassis dyno ranks among the world’s highest-capacity test stands for measuring vehicle performance and fuel consumption. Here, tests are conducted on tractors, machinery and other commercial vehicles.
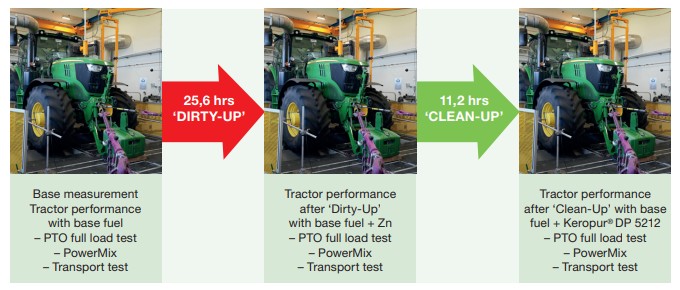
Procedure
1. Baseline measurement with base fuel according to specification above:
- PTO (Power-Take-Off) full load test
- PowerMix
- Transport test
2. “Dirty-Up” performance degradation with base fuel + Zn:
- at full load and engine speed of 1900 rpm
3. Dirty measurement with base fuel + Zn
4. “Clean-Up” with base fuel + Keropur DP 5212 132 ppm(v/v)
5. Clean measurement with base fuel + Keropur DP 5212 132 ppm(v/v)

Tractor Performance Measurement
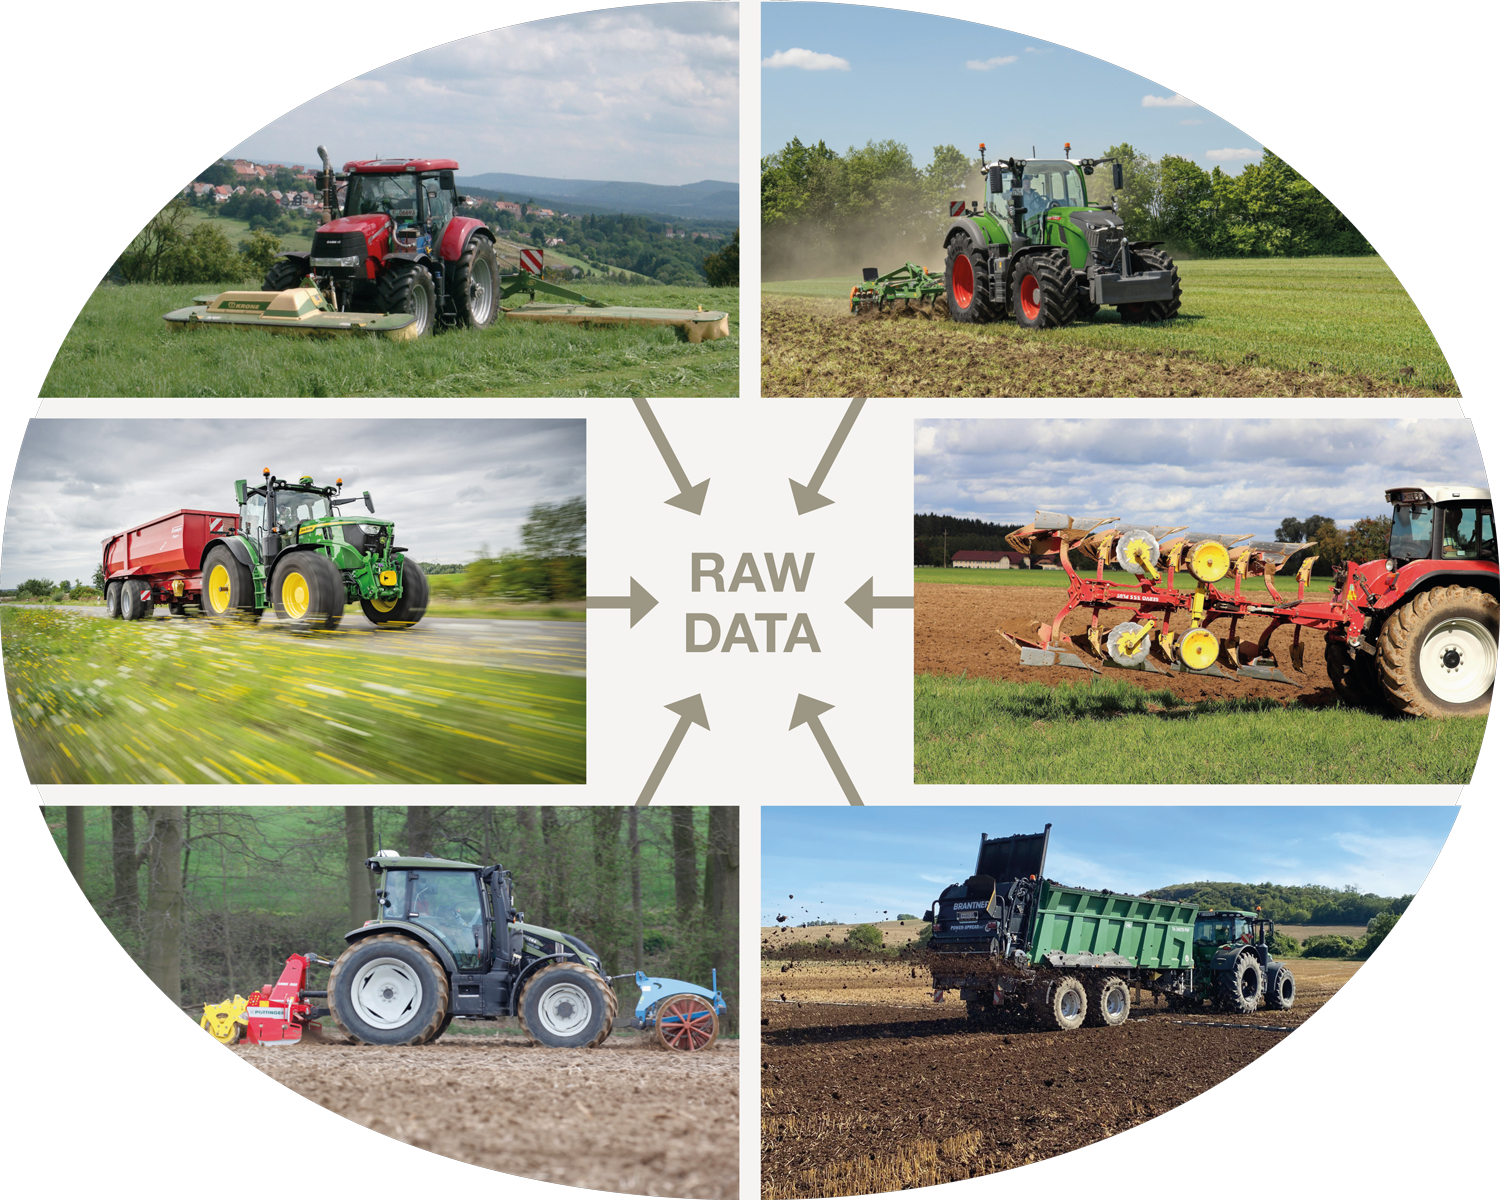
The effect of the deposit-forming diesel fuel was examined using three different test methods to establish a connection between test bench results and practical application.
PTO
Power and fuel consumption measurement at full engine load at the PTO shaft. During these measurements, the full engine speed range from rated speed (2100 rpm) down to low idle (900 rpm) was covered.
Comment
PTO attachments give tractors more versatility and in some cases the PTO is used alone, e.g.:
- Post hole diggers allow owners to dig holes for fence posts, posts for a deck, a pole barn or even plant trees
- Water pumps are used for dredging ponds and irrigating crops on a farm
- Wood chipping
DLG PowerMix
Standard tests, such as OECD Code 2 tests, do not illustrate these dynamic processes, as here the consumptions are recorded in static operating points. In addition, each type of power is considered individually and separately from each other. The total performance of the tractor, the interactions of the systems and any feedback are not taken into account by this test method.
When developing the DLG PowerMix Test, the following objectives were pursued:
- Determination of reproducible results, independent of influences of the soil, the topography and the weather conditions
- Greatest possible practical relevance
- Linear scaling of the load across all performance classes
- Comparison of the efficiency across all performance classes
- With regard to the transport cycles, the net weight of the test vehicle is treated as a parasitic loss when considering the pure tractive power requirement. This makes it possible to establish a relationship between the fuel consumption and the pulling work actually provided and to specify it as a specific fuel consumption.
With the development of the DLG PowerMix, a test method was created that is based on the globally recognized OECD Code 2 Standards and at the same time represents the combination of the greatest possible practical relevance and an extremely high reproducibility and repeatability. Through the interim expansion with the simulation of transport work, another important application of tractors was added.
The test cycles performed on the roller dynamometer are based on real-world load profiles measured in the field. Over time, these profiles have been developed into a practical test procedure that is now recognized across the tractor industry.
Table 1: PowerMix Cycles during test
| Cycle | Load | PTO shaft speed/Output rpm | Driving speed/Output speed | Cycle duration | Evaluation duration | |
| [rpm] | [km/h] | [s] | [s] | ||
| Z1P | Ploughing | 100 % | – | 9 | 320 | 250 |
| Z1G | Cultivation | 100 % | – | 12 | 320 | 250 |
| Z2P | Ploughing | 60 % | – | 9 | 320 | 250 |
| Z2G | Cultivation | 60 % | – | 12 | 320 | 250 |
| Z3K | Rotary harrows | 100 % | 900 | 6 | 320 | 250 |
| Z3M | Mowing | 100 % | 900 | 16 | 320 | 250 |
| Z4K | Rotary harrows | 70 % | 900 | 6 | 320 | 250 |
| Z4M | Mowing | 70 % | 900 | 16 | 320 | 250 |
| Z5K | Rotary harrows | 40 % | 900 | 6 | 320 | 250 |
| Z5M | Mowing | 40 % | 900 | 16 | 320 | 250 |
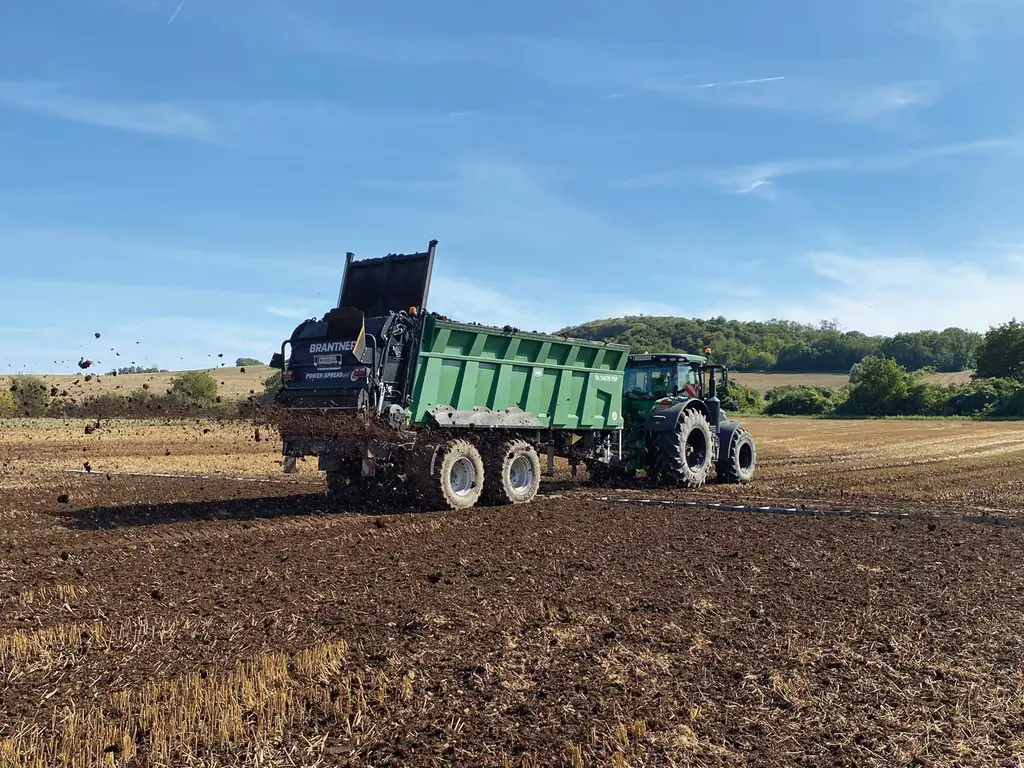
| Z6MS | Spreading manure |
| 1,000 | 7 | 570 | 500 |
| Z7PR | Pressing |
| 1,000 | 10 | 570 | 500 |

DLG Transport Test
The transport test simulates real-world driving scenarios on roads, focusing on how tractors perform during light and heavy transport work. The test consists of driving on flat terrain as well as uphill driving. The permissible trailer weight depends on the tractor’s power. The uphill segments of the hill track have distinct characteristics, which place specific demands on engine and gearbox coordination.
Test results in detail
Table 2:
Overall summary of test results (results after clean up, versus end of dirty up)
| Criteria | Unit | Result | Cleaning effect confirmed |
Engine Power | Engine power recovered 90 % of power loss recovered 100 % of power loss recovered | [kW] [time] / [liter] [time] / [liter] | 11.4 % avg / 13.3 % max 8 hours / 355 liter 11.2 hours / 500 liter | ✓ |
Fuel Consumption | Field Transport | [l/ha] [l/100 tkm] | - 3.9 % avg / - 10.8 % max (pressing) - 1.1 % avg / - 1.3 % max (hill section) | ✓ |
DEF Consumption | Field Transport | [l/ha] [l/100 tkm] | - 8.3 % avg / - 15.2 % max (pressing) -8.4 % avg (40 km/h)/-9.9 % avg (50 km/h) | ✓ |
Productivity | Field Transport | [ha/h] [tkm/h] | + 6.4 % avg / + 18.5 % max (rotary harrow) + 7.2 % avg / + 9.5 % max (hill section) | ✓ |
CO2 | Field Transport | [kg/ha] [kg/100 tkm] | - 3.9 % avg / - 10.8 % max (pressing) - 1.1 % avg / - 1.3 % max (hill section) | ✓ |
The performance was restored to > = 90 % after 8 hours, eq to 355 liter (1 vehicle tank) and to 100 % after 11.2 operating hours, eq to 500 liter (1.6 vehicle tanks) fuel consumption with Keropur® DP 5212 additive, showing significant:
- Increase in engine power and torque at full load measured through the tractors Power-Take-Off (PTO) device.
- Reduction in diesel fuel and DEF consumption as well as increase in productivity parameters during Field- (PowerMix) and Transport work.
Comments
- Engine power recovery describes the difference in engine performance after CU and after DU condition, measured at the PTO shaft (Power-Take-Off). It further indicates how long it took to restore 90 % of the lost power and the time required to fully recover 100 % of the measured engine power at the beginning of the test.
- Fuel-/DEF-usage improvement describes the reduction in fuel-/DEF-usage during field and transport cycles when comparing conditions after DU and after CU.
- Productivity improvement describes the extent to which area performance in hectares per hour during fieldwork, and haul capacity in tonne-kilometres per hour during transport operations, has improved when comparing conditions after DU and after CU. This increase in productivity is a direct result of the restored engine power.
- CO2 improvement describes the reduction in carbon dioxide emissions resulting from improved fuel efficiency and productivity when comparing conditions after DU and after CU. The metric reflects average emission values across field and transport cycles, and highlights the cycle with the greatest CO2 savings.
Manufacturer and applicant
BASF SE,
Carl-Bosch-Str. 38,
67056 Ludwigshafen
fuel-and-lubricants.basf.com
Testing agency
DLG TestService GmbH
Max-Eyth-Weg 1,
64823 Groß-Umstadt
DLG test framework
DLG-PowerMix_2.0 (current as of 01/2025)
Department
Vehicle technology
Test engineer(s)
Hans Joachim Tauber *
* Author
Contact
DLG TestService GmbH - Groß-Umstadt location • Max-Eyth-Weg 1 • 64823 Groß-Umstadt • Tel: +49 69 24 788-600 • tech@DLG.org