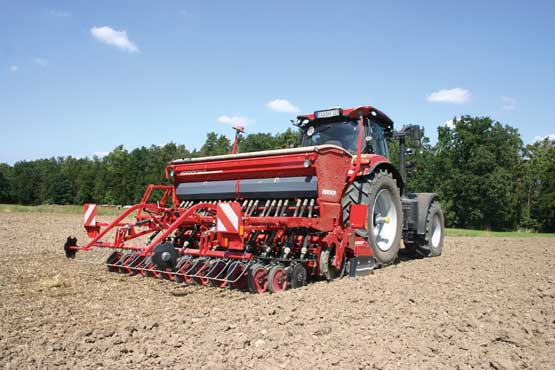
Mechanical drill Horsch Versa 3 KR
"Functionality and quality of work" and "Handling, operation and maintenance"

Thge quality mark
A test mark „DLG-APPROVED for individual criteria“ is awarded for agricultural products which have successfully fulfilled a scope-reduced usability testing conducted by DLG according to independent and recognised evaluation criteria. The test is intended to highlight particular innovations and key criteria of the test object. The test may contain criteria from the DLG test scope for overall tests, or focus on other value-determining characteristics and properties of the test subject. The minimum requirements, test conditions and procedures as well as the evaluation bases of the test results will be specified in consultation with an expert group of DLG. They correspond to the recognised rules of technology, as well as scientific and agricultural knowledge and requirements. The successful testing is concluded with the publication of a test report, as well as the awarding of the test mark which is valid for five years from the date of awarding.
The Versa 3 KR drill was subjected to the DLG test “Functionality and quality of work” in 2023. The test comprised a lab test and a field test. The drill was mounted on a Horsch Kredo 3 HD power harrow during all tests. In the lab test, the DLG engineers examined the metering accuracy* and the lateral distribution for rapeseed, barley and wheat on the stationary drill. Rapeseed was sown on 23 August 2023. The seedbed was described as fine crumbly. On 12 September 2023, the quality of work was assessed by taking samples in the field. Wheat was sown in rather dry conditions on 25 September 2023. After four weeks, the quality of work was assessed by taking samples in the field. The other DLG test module applied was “Handling, operation and maintenance”.
No other criteria were tested in this test.
* The term “metering accuracy” is identical with the term “consistency of application” which was used in previous DLG test reports.
Assessment in brief
The mechanical drill Horsch Versa 3 KR produced an impressive performance in the test and its relevant criteria that were specified in the DLG test framework.
Based on these test results, the mechanical drill Horsch Versa 3 KR is awarded the DLG-APPROVED quality mark in the test modules “Functionality and quality of work” and “Handling, operation and maintenance”.
Table 1: Overview of results
| DLG-quality profile | Evaluation* |
| Functionality and quality of work | ✔ |
Handling, operation and maintenance | ✔ |
* Evaluation range: Requirements fulfilled (✔) / requirements not fulfilled (X)
Table 2: Lab test results (metering accuracy and lateral distribution)
| Test criterion | Test results |
| Metering accuracy in wheat | Deviation of actual rate from target rate: very good and good |
| Metering accuracy in barley | Deviation of the actual rate from the target rate: very good |
| Metering accuracy in rapeseed | Deviation of the actual rate from the target rate: very good |
| Lateral distribution in wheat | very good in flat land and on slopes |
| Lateral distribution in barley | very good in flat land |
| Lateral distribution in rapeseed | very good in flat land |
Table 3: Field test results in rapeseed and wheat
| Test criterion | Test results |
| Metering accuracy in rape | Deviation of actual rate from target rate: Field 1 = very good (0.7 %) / Field 2 = very good (0.7 %) |
| Emergence in rape | very good (98.7 %) |
| Distribution of rape plants along the rows | very good (factor of variation: 0.8) |
| Metering accuracy in wheat | Deviation of actual rate from target rate: very good (-2.1 %) |
| Emergence in wheat | very good (100 %) |
| Distribution of wheat plants along the rows | good (factor of variation: 0.95) |
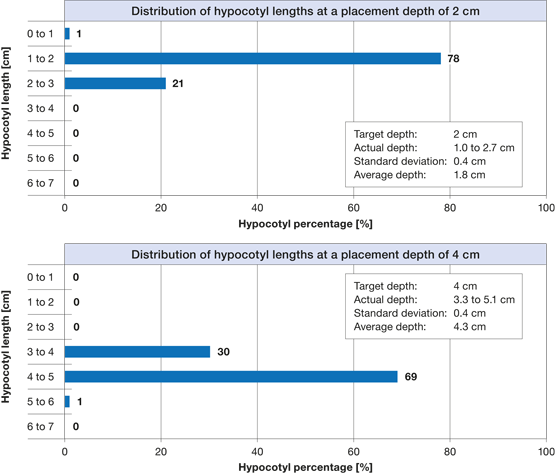
| Depth of seed placement in wheat | Target depth: 2 cm Actual depth (by measuring the hypocotyl length): 1.0 to 2.7 cm Average depth = 1.8 cm, standard deviation = 0.4 cm* Target depth: 4 cm Actual depth (by measuring the hypocotyl length): 3.3 to 5.1 cm Average depth = 4.3 cm, standard deviation = 0.4 cm* |
* The smaller the standard deviation figure, the more consistent is the seed depth.
Table 4: Results of the test module “Handling, operation and maintenance"
| Test criterion | Test results |
| Setting the seed depth | good |
| Access to the calibration test elements | good |
| Storage holders for hydraulic lines | good |
| Lighting system | very good |
| Coulter pressure control | very good |
The product
Description und technical data
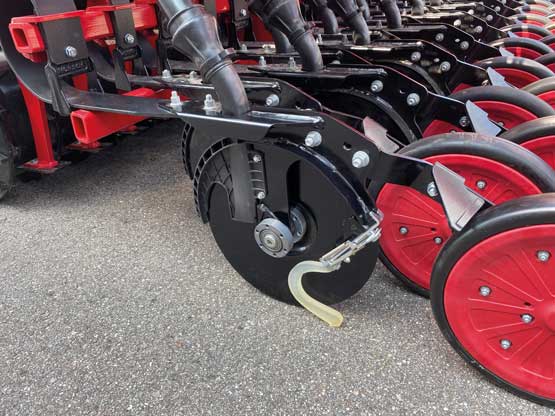
The tested machine was a Horsch Versa 3 KR drill which was mounted on a Horsch Kredo 3 HD power harrow during the DLG test. The test candidate has 20 seed coulters (15 cm row spacing) and a working width of 3 metres. The coulters are arranged in two rows. The inter-row spacing is 15 cm. Each disc on the „DuoDisc“ double-disc coulter has a diameter of 35 cm (Figure 2). The pressure rollers that run behind the coulters measure 34 cm in diameter and 5 cm in width. Horsch also offers 7.5 cm pressure rollers. The tested drill had the so-called heavy harrow tines fitted at the rear.
The drill combination is coupled to the tractor via a three-point headstock (Cat III). Next, four hydraulic lines are connected (one double-acting control device for the two bout markers, the optional preemergence marker and one double-acting control device for hydraulic coulter pressure control).
The electric line powers the road lights. Another line that needs connecting is the ISOBUS line. The drill was operated from the cab-based terminal on the Case IH Puma 185.
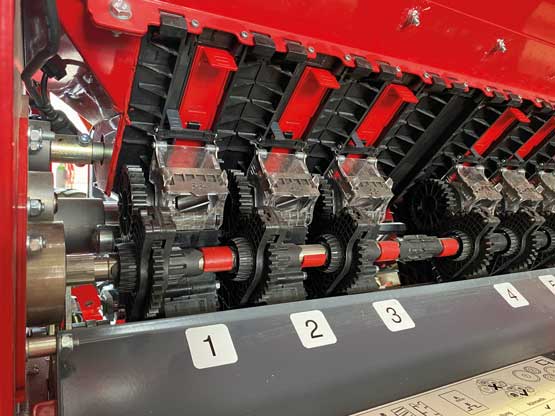
The SmartClip metering system consists of one fine seed wheel and one normal seed wheel for each coulter which are mounted at the bottom of the seed hopper. The operator opens/closes the appropriate slides to deliver the seeds to the respective metering wheels (Figure 3). The rpm of these metering wheels, i.e. the seed rate, is controlled depending on the operational speed by one electric motor. The basic machine offers a mechanical half-width control which means the system is enabled / disabled manually. When combining this optional electric half-width control with the software for automatic section control, it is possible to shut off specific machine sections when drilling awkward headlands or wedges. A work position sensor at the front of the drill senses the current working position of the machine. On an ISOBUS-compatible machine, it is possible to receive the current position of the lifting tools by means of an ISOBUS interface.
The operational speed was recorded by a radar sensor on the test machine. This was mounted at the rear end above the harrow. On an ISOBUS-
compatible machine, the signal can also be received via ISOBUS.
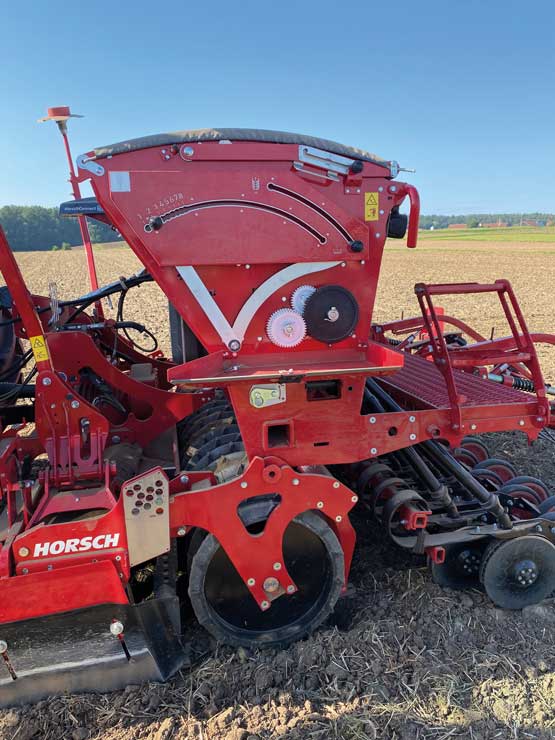
Setting up the machine from the Operating Centre
All machine settings are made from the so-called Operating Centre (Figure 4). Here, the operator initiates the calibration test, sets the seed depth and empties the seed hopper. All operations are carried out from the same position outside the machine.
The machine is supplied with a calibration bag and scales. These items are stored in the toolbox with lid. The controls that operate the calibration flaps and the flaps in the bottom of the hopper are arranged in the Operating Centre at the top.
The agitator is activated and deactivated in the middle of the Operating Centre by opening the cover with the universal tool and refitting a lynch pin.
The split calibration trough is stored at the bottom of the Operating Centre. This is where the operator also adjusts the seed depth with the help of the universal tool supplied.
The coulter pressure was set hydraulically on the tested machine. Thus, it is possible to adjust the pressure while driving from the tractor seat. A large scale clearly shows the current depth.
The seed hopper holds 900 litres of seeds and can be extended to hold another 300 or 600 litres. The agitator inside the hopper is standard equipment (selectable). A basic machine has one adjustable level indicator and a second indicator as an option.
The standard drill has interior LED lights which are switched on when the road lights are switched on. Two LED work lights are available as an option for the drill. These are switched on / off from the operator terminal.
The tested drill was mounted on the Horsch Kredo 3 HD power harrow. This has ten rotors that offer a working width of three metres. The tested power harrow also had a trapeze ring packer. This following packer measures 60 cm in diameter. The rings are spaced at 15 cm. The depth of the power harrow is set by refitting a pin in a pin-and-hole system (right and left).
The power harrow has an exchange gear wheel gearbox for changing the rotor speed. The two side plates are adjusted with the universal tool supplied.
This tool is also used to adjust the levelling bar that is arranged between the power harrow and the following roller. This is done on the left side of the machine. The current setting is indicated on a scale to reproduce the setting. The levelling bar is height controlled by the roller.
The two markers are also mounted to the power harrow. Each marker is impact protected by a shear bolt. There are four spare shear bolts stored on each marker. The markers are set with the universal tool supplied.
The HorschConnect option allows operators to control many functions digitally. On the one hand, operators can operate the machine from the MobileControl app, also for the calibration test. In this case, the smartphone serves as the terminal. The smartphone connects to the machine via the machine’s local Wi-Fi. HorschConnect Telematics also provides access to all machine data for clear information and use.
All parameters including the application rate of all components, machine performance (hour / hectare counter) and position-related error messages of the machine are visualised at https://telematics.horsch.com. You can also import field boundaries for field-specific evaluation. This eliminates the time-consuming, manual documentation.
The method
In a DLG test on “Functionality and quality of work”, the drill is tested at the lab (lab test) and in the field (field test).
The lab test
The lab test measures the metering accuracy and the seed distribution across the direction of travel on a stationary drill for rapeseed, barley, and wheat.
The test is carried out at two different operational speeds. The above parameters are tested in rapeseed and barley with the drill in a level position.
The wheat drilling test includes additional test runs which simulate drilling on a slope.
Lab test – metering accuracy
The metering accuracy test parameter determines whether the seed rate delivered by the drill (actual rate) is identical with the pre-set seed rate (the target rate). The percentage of deviation of the actual rate from the nominal rate is then evaluated according to the DLG test framework (Table 5). The term “metering accuracy” is identical with the term “consistency of application” which was used in previous DLG test reports.
In the DLG test framework on metering accuracy in rapeseed, the sowing process is simulated on a 1 ha field, whereas for barley and wheat the simulated field size is 1/10 ha. This is done by entering a lower and a higher operational speed. The exact operational speeds are chosen in line with the manufacturer’s recommendations.
All drill settings during the lab test are documented (e.g. seed metering speeds).
Lab test – seed distribution across the direction of travel
The distribution of rapeseed, barley and wheat across rows is determined on the stationary and lifted drill.
The distribution of rapeseed and barley is measured in flat land; the wheat drilling tests included also test runs in which drilling on the slope was simulated.
The seeds are collected in boxes that are placed under each coulter. The collected seeds are then weighed. The coefficient of variation (CoV) is calculated from all results. The smaller the coefficient of variation the more uniform is the seed rate across the working width. The calculated coefficient of variation is then referenced to the DLG test framework and is evaluated (Table 6).
Table 5: Assessment of metering accuracy (percentage of deviation between actual and target rate)
| Deviation from the target rate [%] | Evaluation Metering accuracy |
| up to 2.5 | very good |
| up to 5 | good |
| > 5 to 10 | satisfactory |
| > 10 | not sufficient |
Table 6: Assessment of seed distribution across rows using the coefficient of variation
| Coefficient of variation for cereals, peas and grass [%] | Coefficient of variation for rapeseed [%] | DLG evaluation |
| < 2,0 | < 2,9 | very good |
| 2.0 to 3.2 | 2.9 to 4.7 | good |
| 3.3 to 4.5 | 4.8 to 6.6 | satisfactory |
| 4.6 to 6.3 | 6.7 to 9.4 | sufficient |
| > 6.3 | > 9,4 | not sufficient |
The field test
For a drill to pass the DLG test, it is necessary to drill at least two crops: rapeseed and wheat. Before and during the test, the history of the field (previous crop, previous tillage method), the conditions at the time of drilling and the operational speeds are documented.
The varieties sown are specified by variety, breeder and Thousand Grain Mass. The ability to germinate is determined in a lab test.
Soil samples are taken on the day of drilling to determine the soil moisture in the seeding horizon as one of the parameters that describe the test conditions. The soil moisture is determined according to DIN 18121.
While drilling, the metering accuracy is measured and random samples are taken verifying the depth of seed placement. This is done at two depths (2 cm and 4 cm and this includes surface residues).
Field test – emergence
Emergence is evaluated three to five weeks after the crop was sown. This is done by counting the plants that have emerged in several representative 1 m² plots. As a next step, the result of this evaluation is referenced to the DLG test framework and evaluated (Table 7). This takes into account the product’s germination capacity as determined in a lab analysis.
Field test – distribution of plants in direction of travel (along the rows)
The distribution of plants in direction of travel (along the rows) is determined three to five weeks after planting the seeds. This is done by placing a measuring tape along a seed row that is representative for the seed drill. Then the wheat plants that have emerged within the individual 5 cm sections on the metering tape (0-5 cm, 5-10 cm, 10-15 cm) are counted over a distance of 15 metres.
The assessment of seed placement along the rows in rapeseed is carried out for a distance of 30 m and by counting the plants within the individual 15 cm sections (0-15 cm, 15-30 cm, 30-45 cm etc.).
Then, the factor of variation (dispersion index) is calculated from the numbers counted in these 15 cm sections. The factor allows the testers to make a qualified statement on uniform crop spacing in the row. After that, the factor is evaluated (Table 8).
Table 7: Assessment of emergence
| Emergence [%] | DLG evaluation |
| > 90 | very good |
| > 80 to 90 | >good |
| > 70 to 80 | satisfactory |
| > 60 to 70 | sufficient |
| < 60 | not sufficient |
Table 8:Assessment of distribution along rows
| Factor of variation for wheat and rapeseed | DLG evaluation |
| < 0,9 | very good |
| ≥ 0.9 to 1.1 | good |
| ≥ 1.1 to 1.3 | satisfactory |
| ≥ 1.3 to 1.5 | sufficient |
| > 1.5 | not sufficient |
Field test – actual seed depth
The depth placement in wheat is determined by randomly sampling the field at two different seed depths (2 cm and 4 cm). This is done by uncovering 100 plants in one row and measuring the section of the hypocotyl after three to five weeks after drilling. (The hypocotyl is the stem of a germinating seedling between the root and the surface of the soil). These 100 test results are used to calculate the standard deviation which is entered in the test report.
Handling, operation and maintenance
This test module assesses a number of setting options for the drill (e.g. seed depth and coulter pressure).
Furthermore, the following service and maintenance operations are carried out by expert operators while the time is taken:
- Grease all grease nipples incl. the PTO shaft
- Change from transport to work position
- Change from fine seeds to cereals
- Set the seed rate
- Empty 5 kg of residual seeds from the hopper
Detailed account of the test results
The following discusses the results of the lab and field tests and the assessments.
Lab test – metering accuracy and lateral distribution for rapeseed, barley and wheat
The lab tests for determining the metering accuracy and lateral distribution were carried out at operational speeds of 16 km/h and 12 km/h which were entered to the drill. The following seeds were filled into the hopper:
- Rapeseed variety: Adonis from Limagrain (TGW: 6.8 g)
- Barley variety: Sandra from I.G. Pflanzenzucht (TGW: 51.0 g)
- Wheat variety: Informer from Limagrain (TGW: 47.0 g)
Table 9 shows the lab results for the metering accuracy in wheat, barley and rapeseed.
Table 9: Metering accuracy on the test stand (depending on operational speed, hopper filling level and machine tilt)
Seed | Operational | Hopper | Area | Machine | Calibrated (target) | Actual | Devition | Evaluation |
Wheat | 8 | 100 | 1/10 | flat | 141 | 142.6 | 1.1 | very good |
Wheat | 12 | 100 | 1/10 | flat | 141 | 142.3 | 0.9 | very good |
Wheat | 8 | 300 | 1/10 | flat | 141 | 142.4 | 1.0 | very good |
Wheat | 12 | 300 | 1/10 | flat | 141 | 142.0 | 0.7 | very good |
Wheat | 8 | 100 | 1/10 | 20 % to the right | 141 | 143.9 | 2.1 | very good |
Wheat | 12 | 100 | 1/10 | 20 % to the right | 141 | 143.0 | 1.4 | very good |
Wheat | 8 | 300 | 1/10 | 20 % to the right | 141 | 142.2 | 0.9 | very good |
Wheat | 12 | 300 | 1/10 | 20 % to the right | 141 | 142.4 | 1.0 | very good |
Wheat | 8 | 100 | 1/10 | 20 % to the left | 141 | 144.0 | 2.1 | very good |
Wheat | 12 | 100 | 1/10 | 20 % to the left | 141 | 143.5 | 1.8 | very good |
Wheat | 8 | 300 | 1/10 | 20 % to the left | 141 | 143.6 | 1.8 | very good |
Wheat | 12 | 300 | 1/10 | 20 % to the left | 141 | 144.5 | 2.5 | very good |
Wheat | 8 | 100 | 1/10 | 20 % forward | 141 | 135.3 | -4.0 | good |
Wheat | 12 | 100 | 1/10 | 20 % forward | 141 | 135.9 | -3.6 | good |
Wheat | 8 | 300 | 1/10 | 20 % forward | 141 | 135.5 | -3.9 | good |
Wheat | 12 | 300 | 1/10 | 20 % forward | 141 | 135.3 | -4.0 | good |
Wheat | 8 | 100 | 1/10 | 20 % backward | 141 | 145.0 | 2.8 | good |
Wheat | 12 | 100 | 1/10 | 20 % backward | 141 | 146.4 | 3.8 | good |
Wheat | 8 | 300 | 1/10 | 20 % backward | 141 | 145.1 | 2.9 | good |
Wheat | 12 | 300 | 1/10 | 20 % backward | 141 | 143.4 | 1.7 | very good |
Barley | 8 | 100 | 1/10 | flat | 143 | 143.5 | 0.3 | very good |
Barley | 12 | 100 | 1/10 | flat | 143 | 143.3 | 0.2 | very good |
Rape | 8 | 10 | 1 | flat | 3.4 | 3.472 | 2.1 | very good |
Rape | 12 | 10 | 1 | flat | 3.4 | 3.485 | 2.5 | very good |
In all wheat drilling tests on level ground, the difference between the actual and calibrated seed rate was never larger than 1.1 % (“very good” according to the DLG scheme). This percentage increased slightly when operation on the slope was simulated in the test.
The measured maximum deviation was -4.0 % during downhill operation (drill tilted at a 20 % forward angle). This result is rated as „good“ according to the DLG evaluation scheme. It was not affected by the filling level or the operational speed (Table 9).
In barley, the deviating percentage of the actual seed rate from the calibrated seed rate was 0.2 % and 0.3 % in both tests. The tests in rapeseed produced deviations of 2.1 % and 2.5 %. All tests in barley and rapeseed were conducted in flat land and scored a “very good” in the DLG matrix (Table 9).
All tests for lateral distribution in wheat produced „very good“ results both on level ground and on the slope (table 10).
In barley and rapeseed, the results for lateral distribution also scored a „very good“ (Table 10).
Table 10: Seed distribution across the direction of travel on the test stand
| Seed | Operational speed [km/h] | Filling level [kg] | Area drilled [ha] | Machine position and tilt | Calibrated (target) seed rate [kg/ha] | Coefficient of variation (CoV**) [%] | Evaluation of the coefficient of variation |
| Wheat | 8 | 100 | 1/10 | flat | 141 | 1.9 | very good |
| Wheat | 12 | 100 | 1/10 | flat | 141 | 1.8 | very good |
| Wheat | 8 | 100 | 1/10 | 20 % to the right | 141 | 1.7 | very good |
| Wheat | 12 | 100 | 1/10 | 20 % to the right | 141 | 1.4 | very good |
| Wheat | 8 | 100 | 1/10 | 20 % to the left | 141 | 1.4 | very good |
| Wheat | 12 | 100 | 1/10 | 20 % to the left | 141 | 1.3 | very good |
| Wheat | 8 | 100 | 1/10 | 20 % forward | 141 | 0.8 | very good |
| Wheat | 12 | 100 | 1/10 | 20 % forward | 141 | 0.8 | very good |
| Wheat | 8 | 100 | 1/10 | 20 % backward | 141 | 1.6 | very good |
| Wheat | 12 | 100 | 1/10 | 20 % backward | 141 | 1.7 | very good |
| Barley | 8 | 100 | 1/10 | flat | 143 | 1.0 | very good |
| Barley | 12 | 100 | 1/10 | flat | 143 | 1.1 | very good |
| Rape | 8 | 10 | 1 | flat | 3.4 | 1.8 | very good |
| Rape | 12 | 10 | 1 | flat | 3.4 | 2.0 | very good |
** The coefficient of variation (CoV) indicates how much the rate that is actually applied by the individual coulters deviates from the average seed rate. The smaller the coefficient of variation, the more uniform is the distribution of the seeds across the direction of travel.
Field test – winter rapeseed
The test field is characterised by sandy loam (average soil index rating 47) and flat for the most part.
The previous crop was wheat which was harvested in late July 2023, the straw was baled and removed from the field. The stubble was incorporated in early August by a Horsch Cruiser 4 SL with 5 cm wide chisel coulter working at a depth of 10 cm.
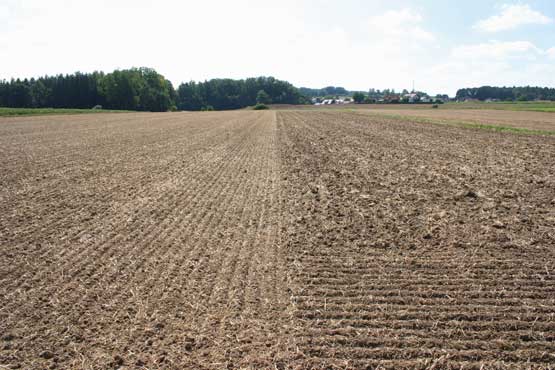
On 19 August 2023, the field received an approx. 25 cm deep cultivation pass by a Horsch Terrano 3 FX cultivator with 7.5 cm MulchMix tines. Rapeseed was sown on 23 August 2023. The seedbed was described as fine crumbly.
For seeding on 23 August 2023, the Horsch Versa 3 KR drill was pulled by a Case IH Puma 185.
The operational speed was 6 km/h. The rear harrow was lifted during the operation.
The winter rapeseed variety sown was Ernesto from KWS (9.2 g TGW, 87 % ability of germination as per LUFA lab analysis).
The analysis of the soil samples that were taken across the field at the seed depth showed an average moisture of 11 %.
Some seeds were uncovered randomly to measure their placement depth. It ranged between 1 cm and 2 cm. All rapeseeds were found to be covered with a sufficient amount of soil.
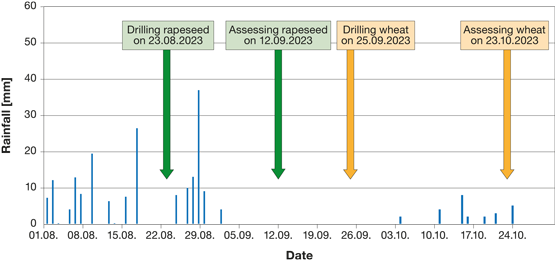
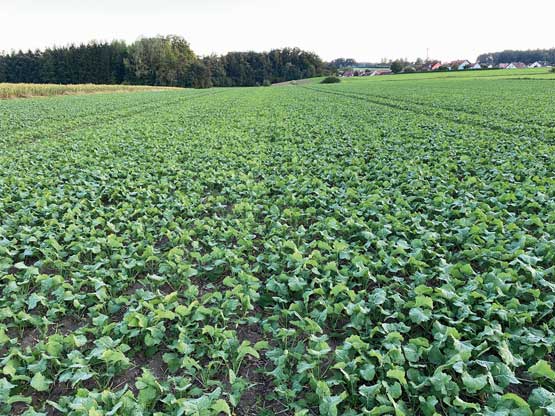
Figure 5 shows the surface of the field immediately after (left) and shortly before sowing. Rainfall during the months of August, September and October are shown in Figure 6. Figure 7 shows the stage of development of the rapeseed crop on 25 September 2023. Table 11 shows the field test results in rapeseed.
Table 11: Field results in winter rapeseed
| Test parameter | Result |
| Metering accuracy in rapeseed | The deviation of the actual seed rate from the calibrated seed rate is assessed as follows: Field 1 = very good (0.7 %) / Field 2 = very good (0.7 %) |
| Emergence | very good (98.7 %) |
| Plant distribution along the rows | very good (factor of variation: 0.8) |
Field test – winter wheat
The test field is characterised by silty loam (average soil index rating of 55).
After the silage maize crop was harvested on 20 September 2023, the field received a ploughing pass at a depth of 30 cm on 24 September 2023; this was followed on the same day by a 5 cm deep seedbed preparation pass with a Horsch Cruiser 4 SL.
The seeding was carried out on 25 September 2023 by the Horsch Versa 3 KR drill that was pulled by a Fendt Vario 724. The operational speed was 7 km/h. The harrow was not used while seeding.
The drilled winter wheat variety was Donovan from KWS (47.2 g TGW, 96 % ability of germination as per LUFA lab analysis). The analysis of the soil samples that were taken across the field from the placement horizon showed moisture levels between 8.1 % and 9.6 %
The seeds were placed at two different depths – at 2 cm and 4 cm. After sowing was completed, the seeds were uncovered randomly to verify their placement depths. It was found that the seeds were placed at the expected depths and that they were covered with a sufficient amount of soil. The amount of rainfall was 21 mm between the date of drilling on 25 September 2023 and 23 October 2023, the date on which the emergence rate, the lateral distribution and the placement depth were assessed (Figure 6, Page 11).
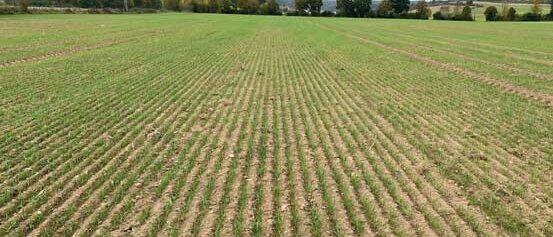
Figure 8 shows the stage of development of the wheat plants on 23 October 2023, the date the soil samples were taken.
Table 12 shows the test results in winter wheat. The wheat seeds were drilled at two different depths in – at 2 cm and 4 cm. The placement depth was verified on 23 October 2023 by uncovering 100 seeds drilled consecutively in a row. This was done by measuring the hypocotyl length of each plant. This is the stem of the seedling just beneath the soil surface. Figure 9 shows the results of these findings in the frequency diagram.
The hypocotyls of the plants sown at the set depth of 2 cm were 1.0 cm to 2.7 cm long (mean length: 1.8 cm, standard deviation: 0.4 cm). The hypocotyls of the plants sown at the set depth of 4 cm were 3.3 cm to 5.1 cm long (mean length: 4.3 cm, standard deviation: 0.4 cm). The smaller the standard deviation the more consistent is the placement depth of the seed.
Table 12: Field results in winter wheat
| Test parameter | Result |
| Metering accuracy in rapeseed | The deviation of the actual seed rate from the calibrated seed rate is very good (-2.1 %) |
| Emergence | At a seed rate of 240 seeds/m²: very good (100 %) |
| Plant distribution along the rows | At a seed rate of 240 seeds/m²: good (factor of variation: 0.95 %) |
| Seed depth (Hypocotyl length) | Target depth: 2 cm Target depth: 4 cm |
* The smaller the standard deviation, the more uniform is the placement depth of the seed.
Handling, operation and maintenance
Table 13 shows the results of the machine handling tests.
The individual maintenance and machine operations were timed at Horsch Maschinen GmbH in Schwandorf in June 2023. The results of this partial test are listed in Table 14.
Table 13: Assessment of machine handling
| Test criterion | DLG evaluation | Comments |
| Setting the placement depth | good | The adjustment spot is easily accessible. The operator uses the universal tool supplied. There is no need to climb into the machine. An easy-to-read scale shows the current setting and ensures consistent settings. |
| Calibration test | good | All operations that are necessary for the calibration test are carried out from the Operating Centre on the left machine side and outside the machine frame. The calibrated seeds are collected in the bag supplied and weighed on suspended scales. The result of the calibration test is entered to the HORSCH MobileControl app on the smartphone. |
| Storage option for the hydraulic lines | good | The hydraulic lines can be marked and neatly stored in a holder. Each hose is coded to mark its function. |
| Lighting system | very good | The light kit is permanently installed. It is not removed for field work. After removing the drill from the tractor, you can store the connector in a dust-free and dry position. |
| Setting the coulter pressure | very good | The coulter pressure is adjusted while driving from the tractor seat by operating a hydraulic control device. A large scale clearly shows the current depth. |
Table 14: Time required for service and maintenance and tractor attachment/removal
| Activity | Test person [min:s] | Average depth | Required tool | |||||
| 1 | 2 | 3 | 4 | 5 | ||||
| Servicing all grease points | 40-hour service intervals (8 nipples) | 0:42 | 0:40 | 0:38 | 0:35 | 0:36 | 0:38 | Grease gun, screwdriver |
| 250-hour service intervals (6 nipples) | 0:29 | 0:31 | 0:26 | 0:29 | 0:27 | 0:28 | ||
| Changeover from transport to work position | Move tramline markers into work position (operator stands next to the drill) | 0:14 | 0:14 | 0:12 | 0:13 | 0:13 | 0:13 | no tool |
| Move tramline markers into work position (operator seated on the tractor) | 0:28 | 0:26 | 0:26 | 0:26 | 0:26 | 0:26 | ||
| Changeover from fine seeds to cereals | Take the universal tool, activate the agitator; close 20 slides at the metering system above the fine seed wheels; open 20 slides above the regular seed wheels | 1:19 | 1:26 | 1:08 | 1:14 | 1:05 | 1:17 | Universal tool supplied |
| Setting the seed rate | Enter the calibrated seed rate into the cab-based operator terminal | 1:42 | 1:55 | 1:50 | 1:55 | 1:56 | 1:52 | Calibration bag and scales supplied |
| Enter the calibrated seed rate into the Horsch MobileControl app on the smartphone | 1:22 | 1:28 | 1:38 | 1:35 | 1:50 | 1:35 | Mobile phone | |
| Empty 5 kg of residual seeds from the hopper | Release the seeds into the calibration troughs, from here pour them into the calibration bag | 1:44 | 1:39 | 1:34 | 1:40 | 1:25 | 1:36 | – – |
The machine weight of the Horsch Versa 3 KR drill that was used to carry out the DLG test was 3,340 kg.
The lowest available machine weight for this model is 2,750 kg and refers to a different equipment (manufacturer information).
The dimensions of the test machine were taken during the DLG test. These are listed in Table 15.
Table 15: Test machine dimensions
| Unit | Measurement [m] |
| Drill length (incl. DuoDisc seed coulter) | 2.84 |
| Drill length (incl. heavy harrow) | 3,20 |
| Drill height (without bout markers) | 1,92 |
| Width in transport position | 3,00 |
Summary
The mechanical drill Horsch Versa 3 KR achieved “very good” and “good” results in all lab tests (metering accuracy and seed distribution across the direction of travel).
The field test in winter rape and winter wheat produced „very good“ and „good” results.
In the test module “Handling, operation and maintenance”, the machine performed „good“ and „very good“.
Based on these test results, the mechanical drill Horsch Versa 3 KR is awarded the DLG-APPROVED quality mark in the test modules “Functionality and quality of work” and “Handling, operation and maintenance” 2023.
Manufacturer and applicant
Contact
DLG TestService GmbH - Groß-Umstadt location • Max-Eyth-Weg 1 64823 Groß-Umstadt Germany • Tel.: +49(0)69 24 788-611 • tech@DLG.org